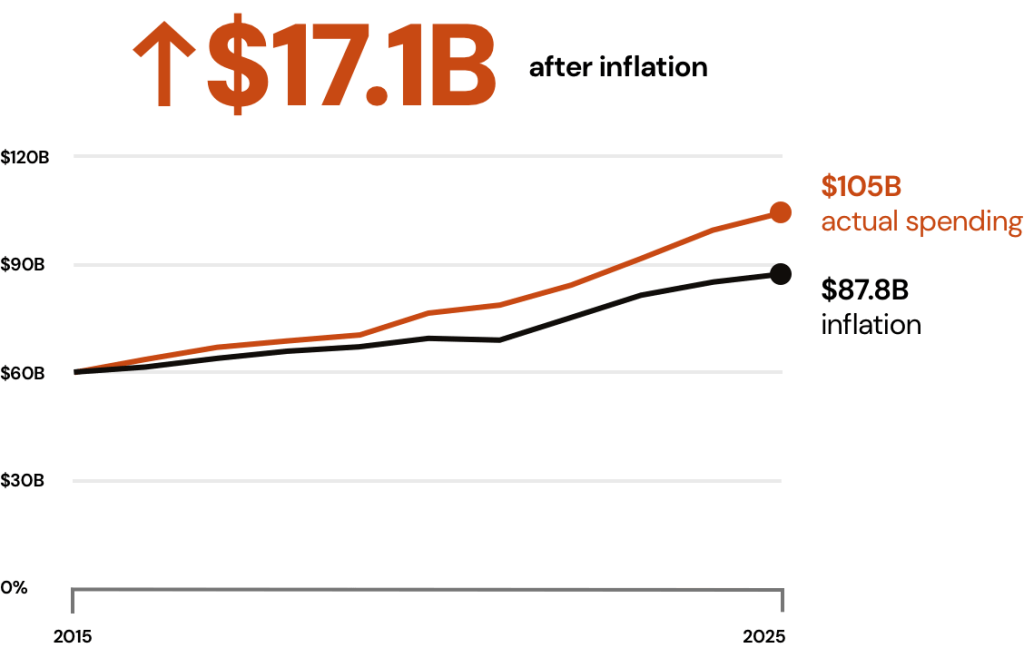
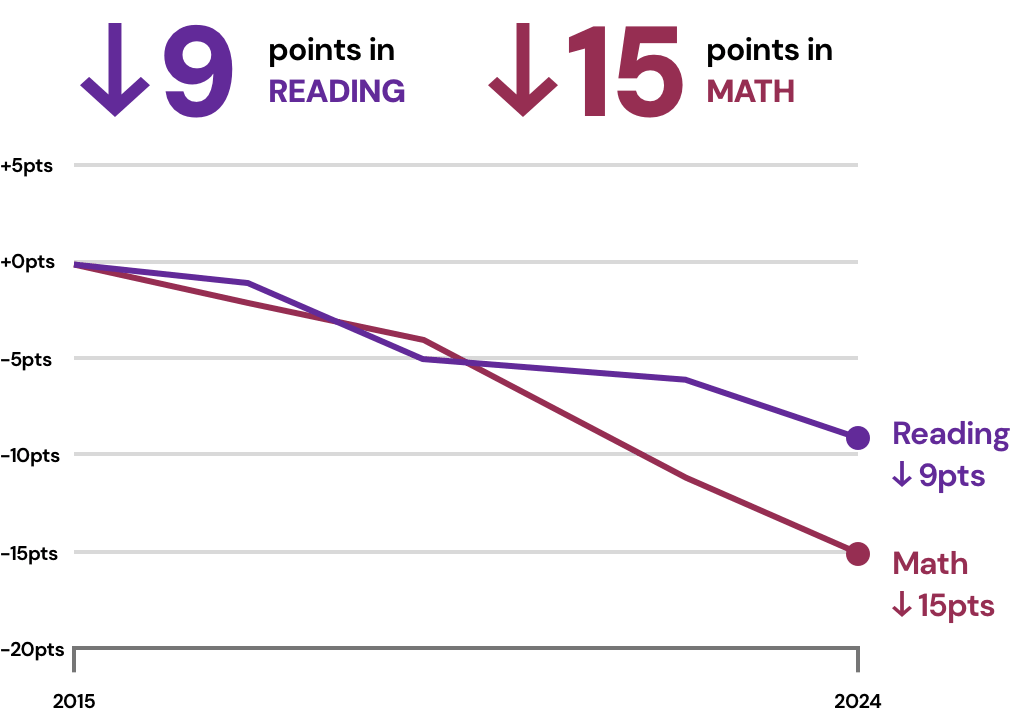
Texas spends more on public education than any state except California — over $105 billion a year. Reading scores are at their lowest level in NAEP history. The funding system is misaligned with student outcomes. This page lays out the data.
If Texas were a country, it would be the 8th largest economy in the world. By that standard, our public schools should be among the best on Earth.
3
out of
10
Only
Texas studentswill finish collegewithin 6 years.
Texas should be the greatest place in America to raise a child
Schools should be the safest place on earth for kids
Deep literacy and mastery of math are pathways to freedom
Transparency is a basic right of taxpayers and parents
Choices and optionality drive intrinsic motivation, quality, and performance
Texas schools should rank #1 on The Nation’s Report Card, which is a measure of reading and math achievement
Schooling should be highly personalized and funds should follow kids
Source: Helping More Students Reach Graduation – THECB Data
Texas STAAR Test Results
Spring 2026
Overall Grades 3–8 + High School Exit Exam Scores
Meets or Masters Content
Math
0
%
Reading/ Language Arts
0
%
Social Studies
0
%
Science
0
%
Source: PEIMS, TEA
The Math
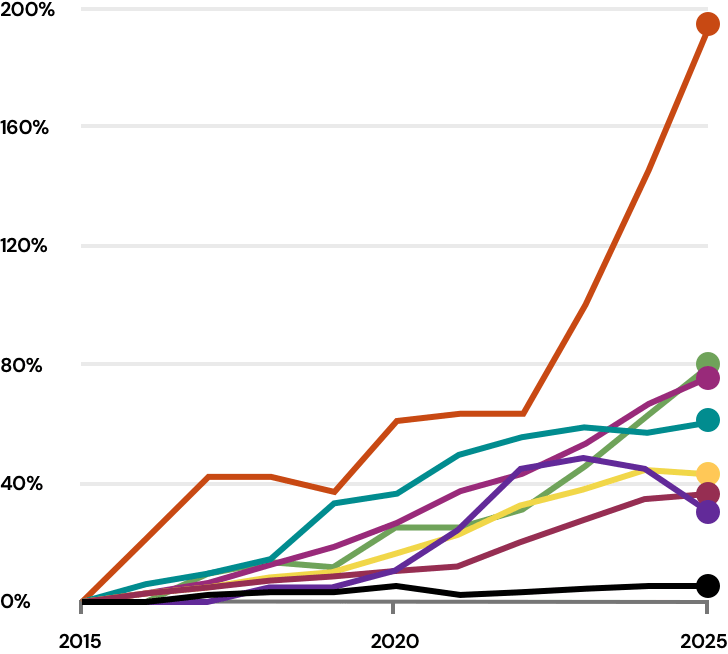
Capital outlay per student is up 196% in ten years. Debt service is up 81%. Operating expenses are up 44%. Enrollment is up 5.9% over 10 years, but went down for the first time in the last year. The gap between investment and student achievement is the problem worth solving.
Capital Outlay
0
%
VS ONLY
Student Enrollment
0
%
In 2026, enrollment declined 1.4%.
196% – Capital Outlay
81% – Debt Service
77% – Special Education Expenses
60% – Fund Balance
44% – Operating Expenses
37% – Consumer Price Index
30% – SCE Programs
6% – Student Enrollment
Source: TEA/PEIMS
School Level Spending Untied to Outcomes
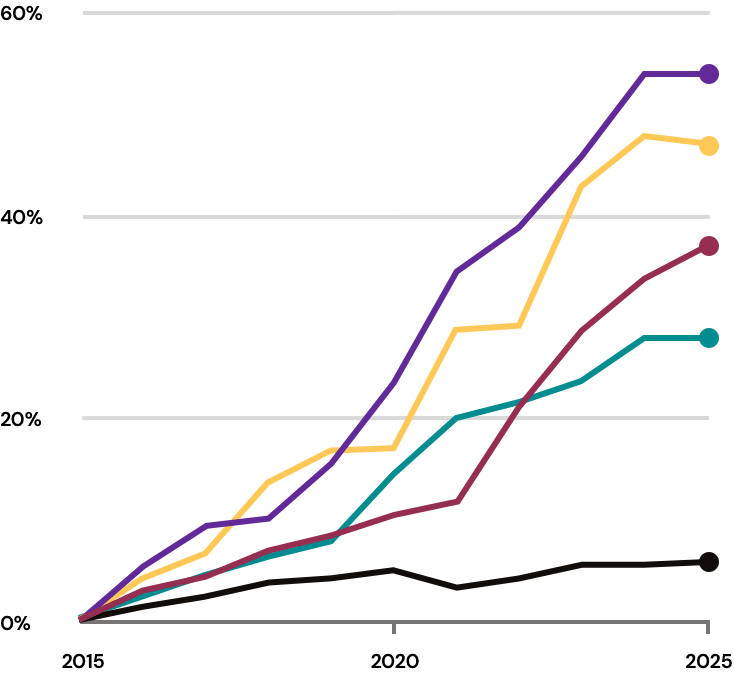
The funds districts already receive are not flowing to the classroom — they are flowing to the org chart. Per-student, professional support staff pay is up 54% in ten years. Administrative staff pay is up 47%. Inflation (CPI) is up 37%.
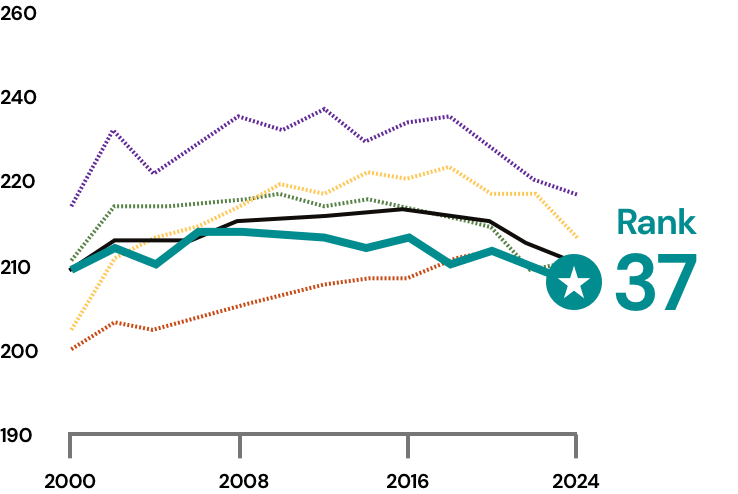
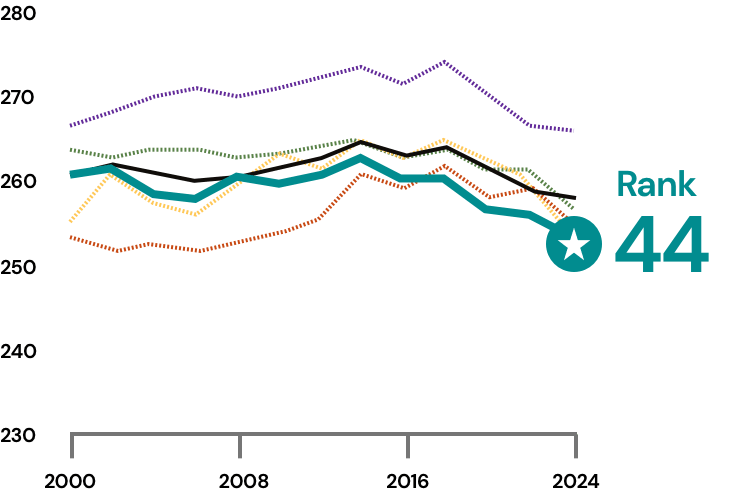
Texas’s 4th-grade reading score is 212 (rank: 37th). 8th-grade reading score is 252 (rank: 44th). The state’s average reading level is 6th grade. Skilled labor jobs require an 8th-grade reading level. Most knowledge work requires at least 10th.
4th Grade ReadingAverage Scores
4th Grade Ranking
0
th
8th Grade ReadingAverage Scores
8th Grade Ranking
0
th
Source: PEIMS, TEA
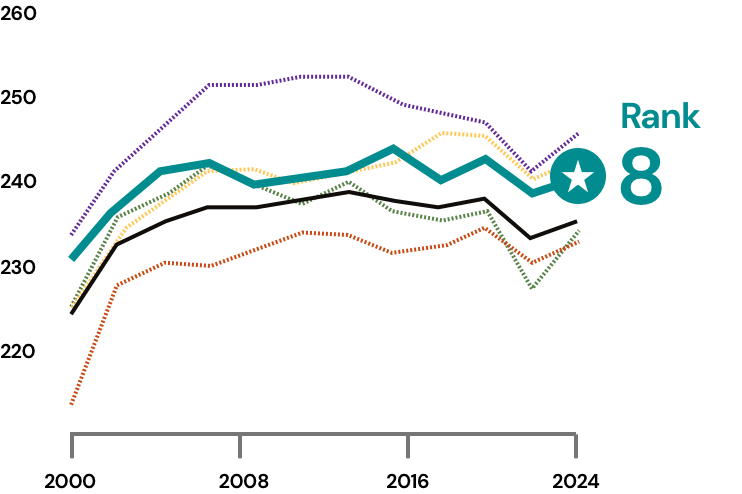
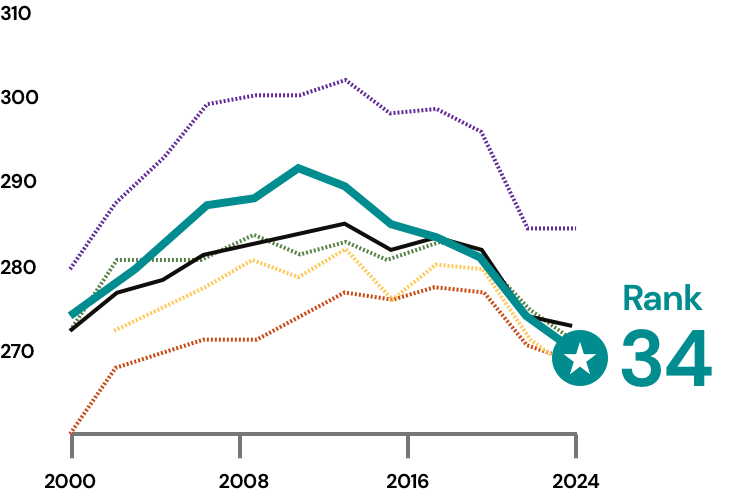
How Texas Stacks Up Against Other States
In 4th-grade reading, Texas ranks 37th — behind Florida, New York, Massachusetts, and the U.S. average. In 8th-grade reading, Texas ranks 44th. Texas leads in 4th-grade math (rank 8) — that lead erodes to 34th by 8th grade. Texas students start strong, then fall behind as they move through the system.